
What we do
Now you know who we are, you can see what we can do.

A major benefit of using us is that the equation for a circle is much simpler

circle
The equation of this circle is r = 3.
Play with some different values for r on Desmos.

SINE
If we type in the equation r = sin(ϴ), we also get a circle. However, this circle sits on the x-axis. The graph shows that the sine of an angle is less than or equal to one.

Cosine
The graph of r = cos(ϴ) behaves similarly but is rotated 90 degrees.
circle
The equation of this circle is r = 3.
Play with some different values for r on Desmos.
SINE
If we type in the equation r = sin(ϴ), we also get a circle. However, this circle sits on the x-axis. The graph shows that the sine of an angle is less than or equal to one.
COSINE
The graph of r = cos(ϴ) behaves similarly but is rotated 90 degrees.
PETALS
r = sin(aϴ)
If we multiply theta by a variable, ‘a’, we can make a graph with petals. When a = 2, we get the graph on the left.
Play around with different values for a .
You may notice that when a is odd, the number of petals equals, however when a is even, the number of petals is double a.
LIMAÇON
r = a – b sin(ϴ)
We can add in values in front of the sine function to change the graph.
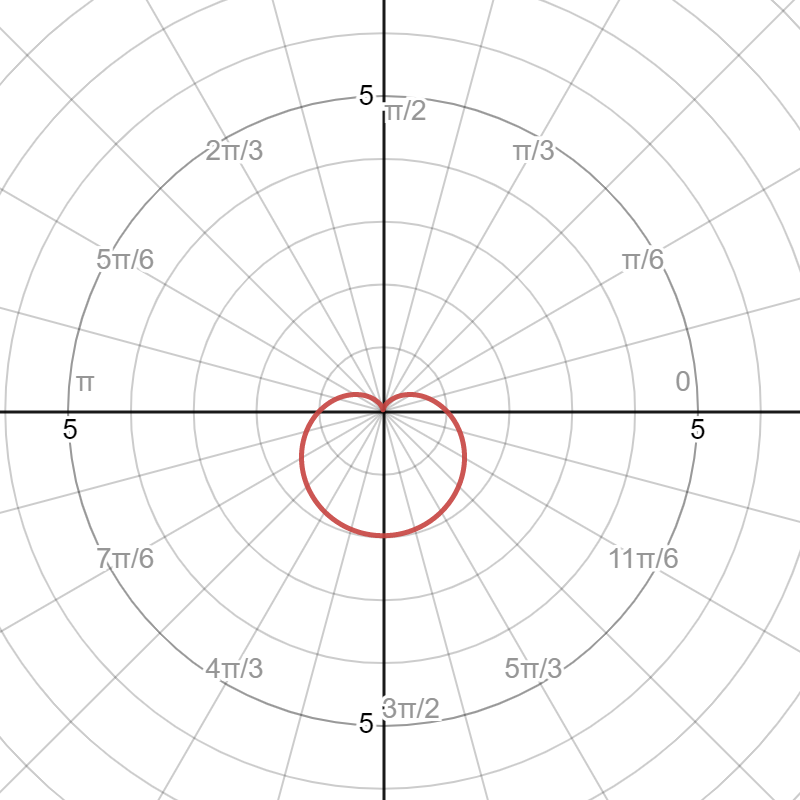
r = 1 - sin(ϴ)
In this case, a = b, it has a special name – the cardioid. The heart of mathematics!
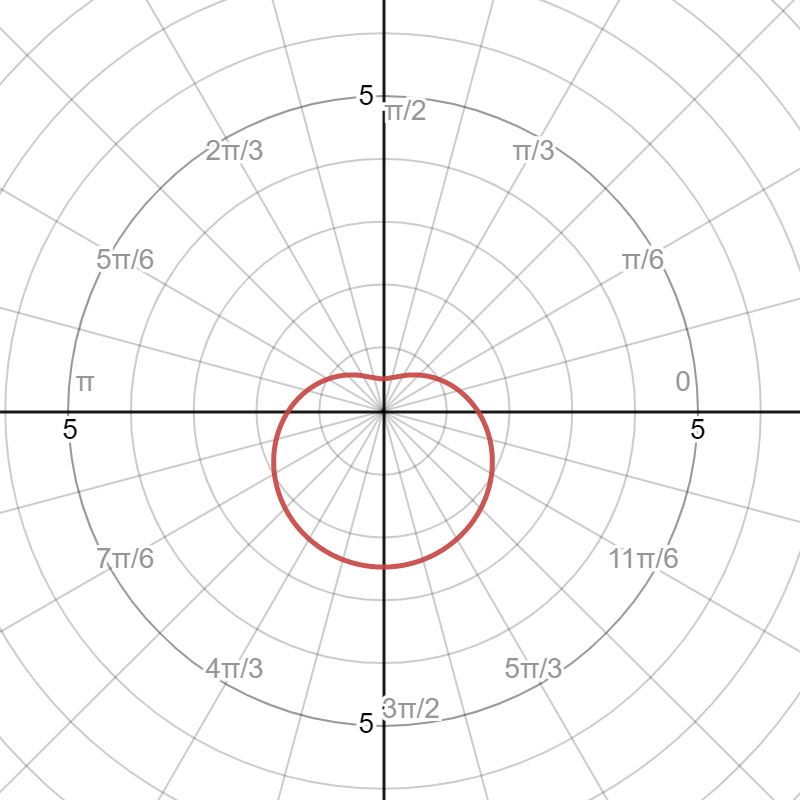
r = 1.5 - sin(ϴ)
The graph when a > b forms a dimpled limacon.
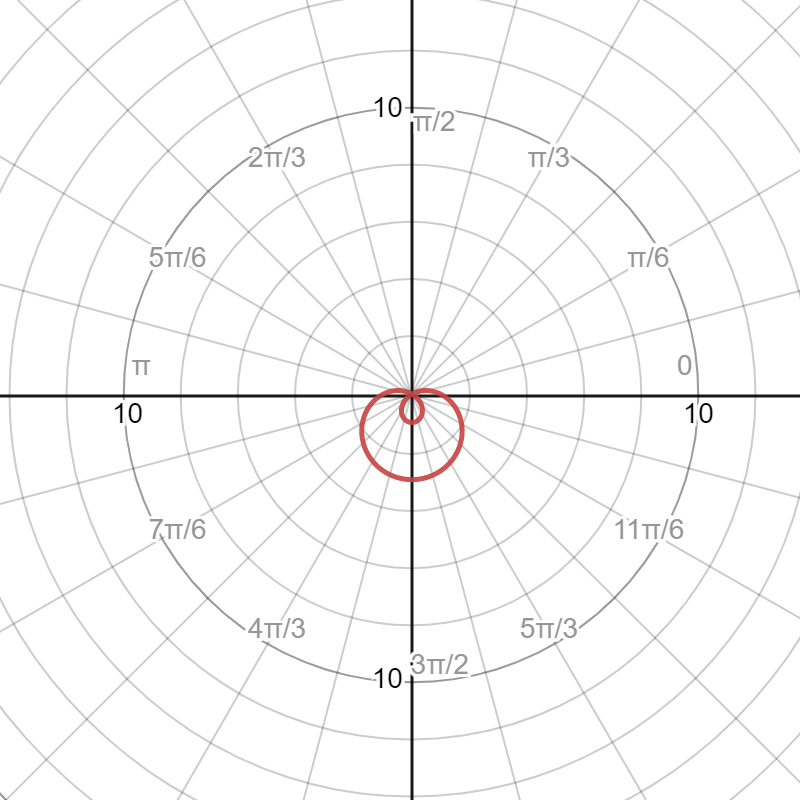
r = 1 - 2 sin(ϴ)
This one has a cute little loop!
PETALS
r = sin(aϴ)
If we multiply theta by a variable, ‘a’, we can make a graph with petals. When a = 2, we get the graph on the left.
Play around with different values for a .
You may notice that when a is odd, the number of petals equals, however when a is even, the number of petals is double a.
LIMAÇON
r = a – b sin(ϴ)
We can add in values in front of the sine function to change the graph.
r = 1 - sin(ϴ)
In this case, a = b, it has a special name – the cardioid. The heart of mathematics!
r = 1.5 - sin(ϴ)
The graph when a > b forms a dimpled limacon.
r = 1 - 2 sin(ϴ)
This one has a cute little loop!
MOVING GRAPHS
With our friend Desmos, you can animate graphs!
r=a-b sin(5ϴ)
If you set the variables a and b to be sliders, and play them, the graphs will move.
r=a-b sin(5ϴ)+5 & r≤a-b sin(5ϴ)
We can also add in another graph to appear inside the other graph. The inequality colours in the graph.
r=sin(4ϴ + d)
To make the graph rotate, we can add a variable d inside the sine function
ROSES
r = 3+3sin(5.5ϴ/3)
By multiplying theta by a fraction, we can create some cool rose graphs.
Have a play around in Desmos with different fractions.

ROSES
r = 3+3sin(5.5ϴ/3)
By multiplying theta by a fraction, we can create some cool rose graphs.
Have a play around in Desmos with different fractions.
MOVING GRAPHS
With our friend Desmos, you can animate graphs!
r=a-b sin(5ϴ)
If you set the variables a and b to be sliders, and play them, the graphs will move.
r=a-b sin(5ϴ)+5 &
r≤a-b sin(5ϴ)
We can also add in another graph to appear inside the other graph. The inequality colours in the graph.
r=sin(4ϴ + d)
To make the graph rotate, we can add a variable d inside the sine function
ROSES
r = 3 + 3 sin(5.5ϴ/3)
By multiplying theta by a fraction, we can create some cool rose graphs.
Have a play around in Desmos with different fractions.